

By Dr. Lee Stoner
Introduction
You have probably read p < 0.05 as “95% sure the result is real.” Many of the scientists who write the studies read a p-value the same way, and they are wrong. This article shows why, and what to read instead.
The confusion starts early. In a survey of 362 psychology students and researchers, 99% answered at least one p-value question wrongly.1 Headlines then add their own spin, since a third of 462 university press releases exaggerated causal claims.2
A p-value measures how surprising your data would be with no effect, not the chance the effect is real. Only a Bayesian analysis can give you that.
| Objective | Outcome |
|---|---|
| What a p-value actually measures | Read “p < 0.05” without overclaiming |
| What the 95% in a confidence interval means | Spot the most common interval mistake |
| How Bayesian and prediction intervals differ | Choose the number that answers your question |
The p < 0.05 Myth: What a P-Value Actually Measures
A p-value answers one narrow question: with no real effect, how often would chance give data at least this extreme? In 2016, the American Statistical Association stated that p-values do not measure the probability that a hypothesis is true.3 Think of a wet street: rain makes one likely, yet a wet street does not prove rain, because sprinklers exist.
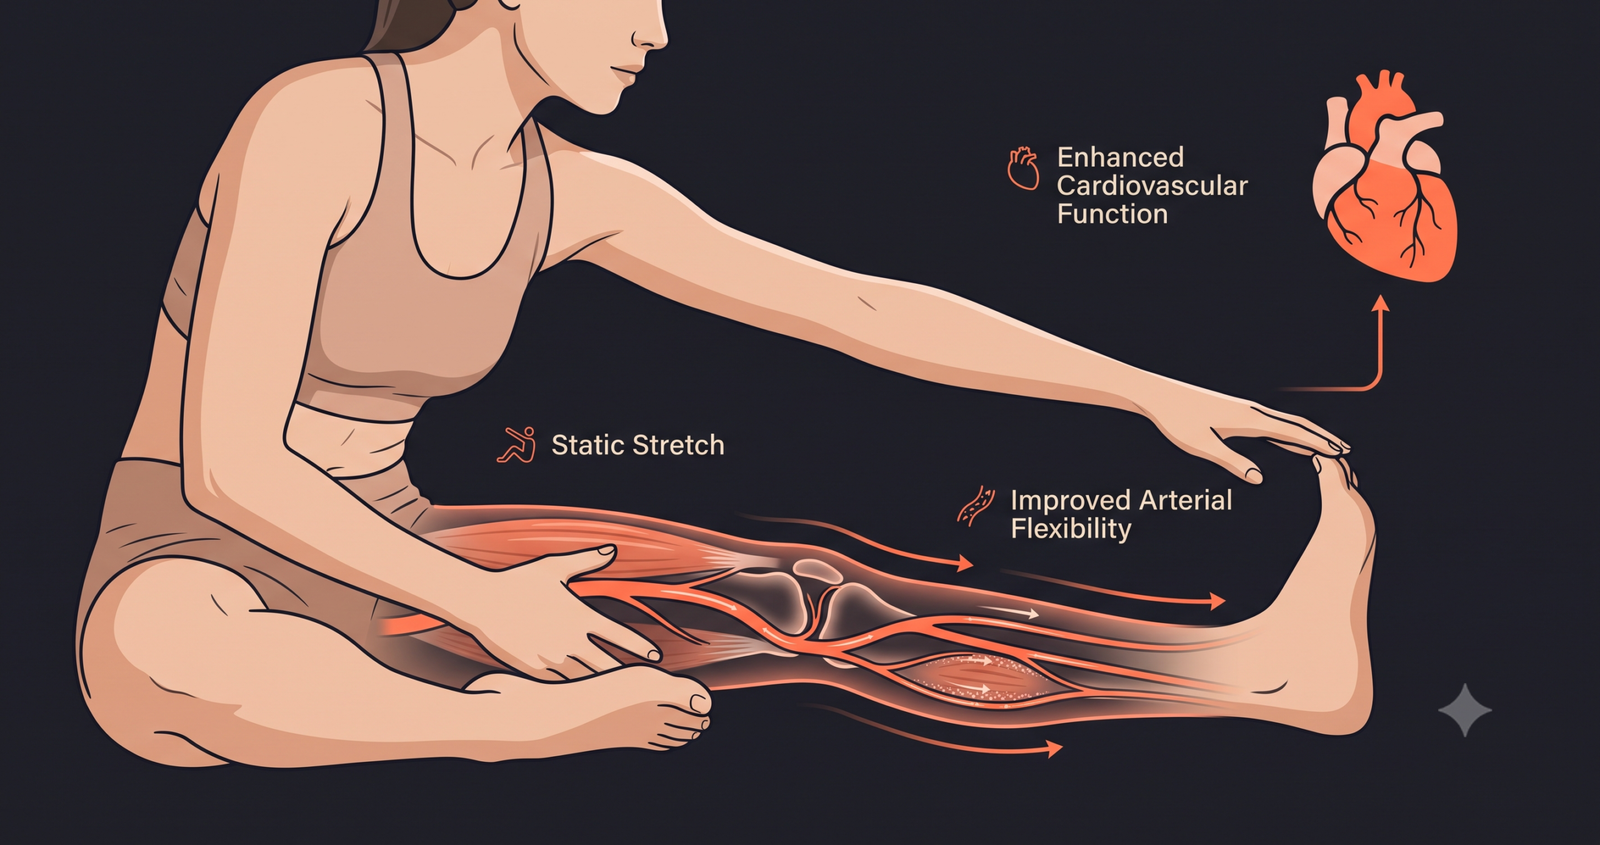
The mistake also runs in reverse: about half of 791 reviewed articles treated non-significance as proof of no effect.4 For example, one stretching meta-analysis, a study that pools many studies, found a non-significant result (p = 0.258).5 However, its effect size, which measures how big the change was, ranged from moderate benefit to slight harm (−0.22, 95% confidence interval [CI] −0.62 to 0.17).5
A p-value measures surprise under no effect, never the chance that the effect is real.
Frequentist Misconceptions About the 95% Confidence Interval
Frequentist statistics, the approach behind p-values, defines probability as how often something happens over many repeats. That sets the second trap, because a 95% CI does not have a 95% chance of holding the true value. Instead, the 95% describes the method. Repeat the study many times, and about 95 of every 100 intervals will capture the truth. Your one interval, however, either contains it or does not.
Statisticians list the single-interval reading among 25 common misinterpretations,6 yet it is still hard to shake. When 120 researchers and 442 students judged six false interval statements, both groups accepted more than three on average. In fact, only 3% of researchers rejected all six.7
The 95% belongs to the method, not to your interval.
Bayesian Analysis and the Credible Interval
So where does the statement people want come from? A Bayesian analysis starts with a prior probability, an assumption stated before data arrive, then updates it with the data. Given the data and prior, a credible interval holds the true value with 95% posterior probability.
The Pfizer COVID-19 vaccine trial used this approach, although its report called a credible interval a confidence interval, a common mislabeling.8 Even with a cautious prior set around 30% efficacy, the data gave a probability above 99.99% that efficacy exceeded 30%.8
| Number | The question it answers | Needs a prior? |
|---|---|---|
| P-value | If the null hypothesis of no effect were true, how surprising are these data? | No |
| 95% confidence interval | Which values does a method that is right 95% of the time give? | No |
| 95% credible interval | Where is the true value, with 95% posterior probability? | Yes |
| 95% prediction interval | What effect might the next study or setting show? | No (frequentist version) |
Only a credible interval puts a probability on the true value, and its prior shapes that answer.
The Prediction Interval: Will It Work Next Time?
A prediction interval answers a fourth question: where will the true effect fall in a new study or setting? In one meta-analysis of geriatric rehabilitation, the pooled odds ratio was 1.36 (95% CI 1.07 to 1.71), where 1 means no effect. However, the prediction interval ran from 0.70 to 2.64, so it crossed that line.9 This pattern is also common. Across 479 significant Cochrane meta-analyses with differences between studies, 72.4% had prediction intervals that included no effect or the opposite effect.10
A confidence interval describes the average effect, while a prediction interval tells you what to expect next.
Takeaway
Next time a headline claims statistical significance, ask how surprising the result would be if nothing were going on. That is the only question a p-value answers. Then find the effect size and its interval before deciding it matters. For the probability that an effect is real, you need a Bayesian analysis with a stated prior.
“P-values do not measure the probability that the studied hypothesis is true.”3
American Statistical Association, 2016
References
- Lyu Z, Peng K, Hu CP. P-value, confidence intervals, and statistical inference: a new dataset of misinterpretation. Front Psychol. 2018;9:868. doi:10.3389/fpsyg.2018.00868
- Sumner P, Vivian-Griffiths S, Boivin J, Williams A, Venetis CA, Davies A, et al. The association between exaggeration in health related science news and academic press releases: retrospective observational study. BMJ. 2014;349:g7015. doi:10.1136/bmj.g7015
- Wasserstein RL, Lazar NA. The ASA’s statement on p-values: context, process, and purpose. Am Stat. 2016;70(2):129-33. doi:10.1080/00031305.2016.1154108
- Amrhein V, Greenland S, McShane B. Scientists rise up against statistical significance. Nature. 2019;567(7748):305-7. doi:10.1038/d41586-019-00857-9
- Logan JG, Chauntry AJ, Zhao H, Park S, Stoner L. Musculoskeletal stretching and arterial stiffness: systematic review and meta-analysis of acute and longitudinal interventions. Sports Med. 2026. Epub 2026 Jul 26. doi:10.1007/s40279-026-02483-8
- Greenland S, Senn SJ, Rothman KJ, Carlin JB, Poole C, Goodman SN, et al. Statistical tests, P values, confidence intervals, and power: a guide to misinterpretations. Eur J Epidemiol. 2016;31(4):337-50. doi:10.1007/s10654-016-0149-3
- Hoekstra R, Morey RD, Rouder JN, Wagenmakers EJ. Robust misinterpretation of confidence intervals. Psychon Bull Rev. 2014;21(5):1157-64. doi:10.3758/s13423-013-0572-3
- Ji Y, Yuan S. Lessons learned from the Bayesian design and analysis for the BNT162b2 COVID-19 vaccine phase 3 trial. N Engl J Stat Data Sci. 2025;3(2):159-63. doi:10.51387/26-NEJSDS93
- Riley RD, Higgins JPT, Deeks JJ. Interpretation of random effects meta-analyses. BMJ. 2011;342:d549. doi:10.1136/bmj.d549
- IntHout J, Ioannidis JPA, Rovers MM, Goeman JJ. Plea for routinely presenting prediction intervals in meta-analysis. BMJ Open. 2016;6(7):e010247. doi:10.1136/bmjopen-2015-010247
Useful Resources
- American Statistical Association: statement on statistical significance and p-values. The six principles statisticians agreed on for using and reading p-values.
- NIST e-Handbook of Statistical Methods: confidence limits for the mean. A clear account of the repeated-sampling meaning of a confidence interval.
- US FDA: guidance on Bayesian statistics in medical device clinical trials. How a regulator expects prior information to be chosen and reported.
- Cochrane Methods: explainer on random-effects methods and prediction intervals. How health evidence reviews now report the range a new study might show.
FAQs
Does p < 0.05 mean a 95% chance the result is real?
No. In hypothesis testing, it means data this extreme would be unusual under the null hypothesis of no effect, which is a different claim. The ASA statement on p-values explains clearly why those two ideas differ.
What is the difference between a confidence interval and a credible interval?
A confidence interval describes how often the method captures the truth across many studies. A credible interval gives a probability for this result, given a stated prior. The US National Institute of Standards and Technology (NIST) statistics handbook explains the repeated-sampling view.
Is a non-significant result proof of no effect?
No. Check the interval first; if it includes a meaningful benefit or harm, the study simply could not tell. Our stretching post is a good place to practice reading intervals.
When should I look for a prediction interval?
Look for one whenever a meta-analysis pools studies that differ, because it shows what a new study might see. Cochrane Methods explains how its reviews report it.
Do regulators accept Bayesian analysis?
Yes, in some settings. For example, the US Food and Drug Administration (FDA) has guidance on Bayesian statistics for medical device trials, including how to use prior information.



Leave a Reply